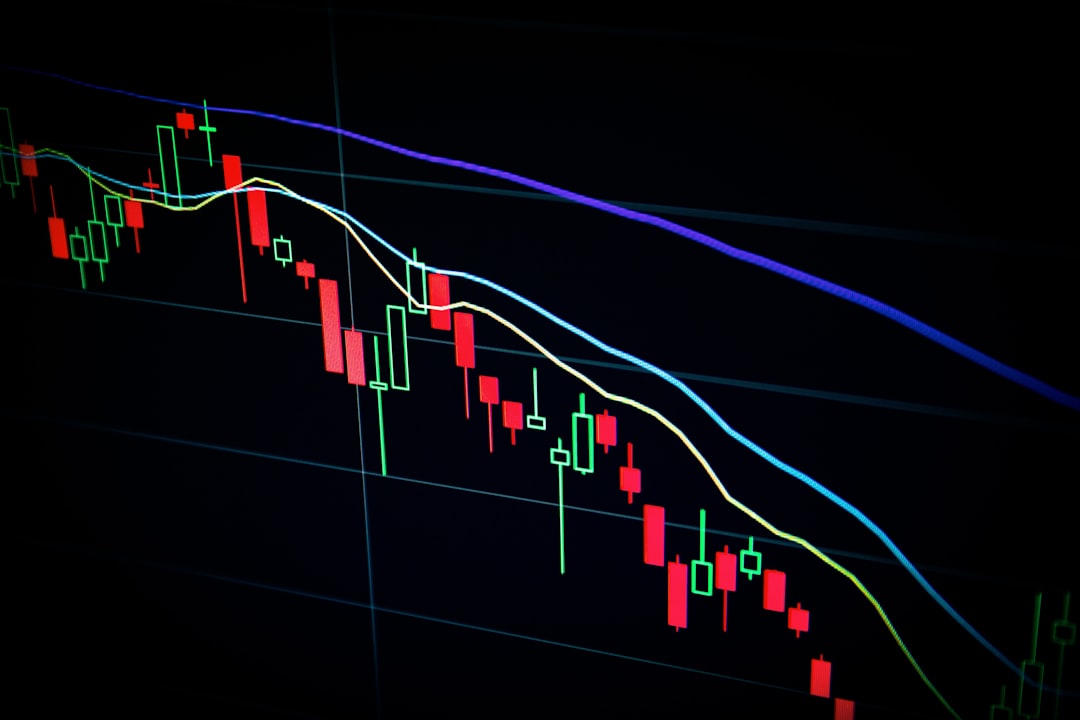
Technical analysis forms the backbone of decision-making for a large portion of active forex traders. Rather than focusing on the economic forces driving currency values, technical traders study price itself—how it moves, where it pauses, and what patterns it forms over time. The premise is that all relevant information is already reflected in price, making charts a powerful tool for anticipating future movement. Applying technical analysis effectively requires understanding a core set of tools and knowing how to combine them into a coherent forex trading strategy.
What Are Support and Resistance Levels and Why Do They Matter?
Support and resistance are among the most fundamental concepts in technical analysis. Support refers to a price level where buying interest has historically been strong enough to prevent further decline. Resistance is the opposite—a level where selling pressure has consistently pushed prices lower.
These levels act as reference points for traders making entry and exit decisions. When price approaches a known support level, traders look for signs that buying is resuming. When it nears resistance, they watch for signs of selling pressure returning.
The more times a level has been tested and held, the greater its significance. Breaks above resistance or below support often signal the beginning of a stronger directional move.
How Do Moving Averages Help Identify Trends?
Moving averages smooth out price data over a defined period, making it easier to identify the overall direction of a trend without being distracted by short-term fluctuations. Traders commonly use multiple moving averages together to gain a clearer picture of momentum and trend strength.
When a shorter-term moving average crosses above a longer-term one, it often signals growing upward momentum. The reverse—a shorter average crossing below a longer one—may indicate that downward pressure is building.
Moving averages are most useful in trending markets. In choppy, sideways conditions, they can produce misleading signals, which is why experienced traders rarely use them in isolation.
What Is the Role of Candlestick Patterns in Forex Trading?
Candlestick patterns offer a visual representation of market psychology. Each candlestick reveals the open, high, low, and close for a given time period, providing insight into how buyers and sellers interacted during that session.
Specific patterns, such as engulfing candles, pin bars, or inside bars, can signal potential reversals or continuations depending on where they form on the chart. A reversal pattern forming at a key support level carries significantly more weight than the same pattern appearing in the middle of a range.
Reading candlestick patterns accurately takes practice, but once internalized, they become a valuable addition to any technical trading approach.
How Do Oscillators Complement Price Action Analysis?
Oscillators are indicators that measure the speed and change of price movement, helping traders identify when a currency pair may be overbought or oversold. When price has moved sharply in one direction, oscillators can signal that the move is losing momentum and a correction may be approaching.
The key is context. An oversold reading during a strong downtrend does not automatically mean price will reverse. Oscillators are most effective when combined with price action signals and key levels, rather than being used as standalone entry triggers.
What Is the Importance of Multiple Timeframe Analysis?
Looking at a currency pair across different timeframes gives traders a more complete picture of what is happening in the market. A setup that looks promising on a shorter timeframe often becomes clearer when viewed against the backdrop of a higher timeframe trend.
For example, identifying the dominant trend on a daily chart and then dropping to a shorter timeframe to refine the entry point allows traders to align their trades with the larger market structure. This approach reduces the risk of entering against a dominant trend based on misleading short-term signals.
Putting Technical Analysis to Work
Technical analysis is a skill that develops through consistent practice and honest evaluation of results. The tools discussed here—support and resistance, moving averages, candlestick patterns, oscillators, and multiple timeframe analysis—work most effectively when combined thoughtfully. Start with a few tools, master them thoroughly, and build your technical approach from a place of genuine understanding rather than surface-level familiarity.